CS 371: Module 9: Exercise 0 (1.5 Points)
Module content by Professor Tralie. Module autograder developed by Professor Tralie and Professor Mongan.
Exercise Goals
The goals of this exercise are:- To apply recursive calls that track depth to reach a stopping condition
Fill in the code below to draw the Sierpinski triangle up to a specified MAX_DEPTH of recursion. If you are not at the max recursion, you will need to make a few recursive calls. The image below should help you to figure out which coordinates to draw in each recursive call. Be sure to add one to the depth parameter on each recursive call to avoid infinite recursion!

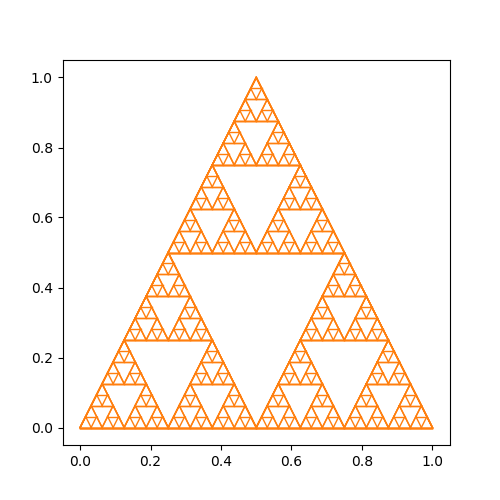
If this worked properly, you should see the following image
Enter your Ursinus netid before clicking run. This is not your ID number or your email. For example, my netid is ctralie (non Ursinus students can simply enter their name to get this to run, but they won't get an e-mail record or any form of credit)
| Netid |
import io, base64
img_str = ""
def save_figure_js():
global img_str
buf = io.BytesIO()
plt.savefig(buf, format='png')
buf.seek(0)
img_str = "data:image/png;base64,{}".format(base64.b64encode(buf.read()).decode('UTF-8'))
Imports / Setup
import numpy as np
import matplotlib.pyplot as plt
MAX_DEPTH = 6
def draw_triangle(x0, y0, x1, y1, x2, y2, c="C1", linewidth=1):
"""
Draw a triangle at the specified coordinates
Parameters
----------
x0, y0, x1, y1, x2, y2: Coordinates of points
c: string
Color
linewidth: float
linewidth of line to draw
"""
plt.plot([x0, x1], [y0, y1], c, linewidth=linewidth)
plt.plot([x1, x2], [y1, y2], c, linewidth=linewidth)
plt.plot([x2, x0], [y2, y0], c, linewidth=linewidth)
Student Code
def draw_sierpinski(x0, y0, x1, y1, x2, y2, depth=0):
"""
Draw a sierpinski triangle at the specified coordinates
Parameters
----------
x0, y0, x1, y1, x2, y2: Coordinates of points
depth: int
Depth of the recursion
linewidth: float
linewidth of line to draw
depth: int
Depth of recursion
"""
if depth < MAX_DEPTH:
draw_triangle(x0, y0, x1, y1, x2, y2)
ax = (x0+x2)/2
bx = (x1+x2)/2
cx = (x0+x1)/2
ay = (y0+y2)/2
by = (y1+y2)/2
cy = (y0+y1)/2
## TODO: Do recursive calls to draw_sierpinski
Test Code Block
plt.figure(figsize=(5, 5), dpi=100)
draw_sierpinski(0, 0, 1, 0, 0.5, 1)
save_figure_js()